I attended Monitorama 2017 in PDX a few days ago. It’s a fantastic conference, which anybody running or writing a production service should attend.
All talks were live streamed and recordings are available - day1, day2 and day3. I chose to attend since it let’s me give my full attention to the speakers. It also served as a great off-site or an ops person’s retreat :). There is something special about “being” at the venue, relevant chatter and meeting other folks. Also I got to visit Portland, which I loved!
It’s a single track conference so there is no need to pick and choose which removes any FOMO. I am going to go over my favorite sessions. Don’t get me wrong, all the speakers/content was amazing, I am listing the ones which resonated with me.
All talks interleaved various themes but had their areas of focus. I would classify them under
- practice
- tools
- math
Practice
This theme covers methodology and processes used by various teams to be effective at monitoring and thus pursue better #opslife. Some of it is anecdotal in nature and some of it falls in the category of general advice. Many companies also presented their “Ops” stack => systems used to manage/store metrics, dashboards, logs and alerts.
Monitoring in the Enterprise by Bryan Liles
A key takeaway for me was the role of the “Enterprise Monitoring Team” when you have several small product teams running their production systems. Each team should be responsible for the monitoring and on-call of their products. The Enterprise Monitoring Team should measure
- “contracts” between services (example - team A using team B’s micro-service)
- the whole organization’s Service Level Agreement/Objectives
The “Enterprise” team should also research and suggest best practices for monitoring.
Product teams should build “observability” in their product from the beginning. Instead of returning a blank 200 OK for a health check, add more context
Bryan’s talk was entertaining and spot on. I have had experience with Ops teams at small, medium and big corporations and he hit the nail on the head.
State of On-Call 2017 Edition
There were several talks about improving the experience of On-Call Engineers. This covered alerting methodologies, fatigue, burn-out, as well as should devs be on call? (The answer is mostly yes)
My favorite talk on this topic was “Martyrs on Film: Learning to hate the #oncallselfie” by Alice Goldfuss. Often Ops Engineers like to be “the hero who saved the day”, this is bad (even if it feels good at first). Alice’s delivery was fantastic and her experience really resonated with the phase of my life when I pulled all-nighters regularly and used to believe that “this is normal”.
Tools
It’s always tempting to hope for the one tool which will solve everything, BUT <<insert other tool cliches here>> :) There were numerous tools/vendors/sponsors on-site. Rest-assured monitoring is still not a solved problem :)
Distributed Tracing
My current team uses the idea of passing a request-id all the way down to the stack starting from the client. This lets us trace calls as they traverse the stack as well as other services not owned by us.
There were two talks which took this to the next level using open standards
- “Distributed Tracing: How We Got Here and Where We’re Going” by Ben Sigelman
- “Distributed Tracing at Uber Scale: Creating a Treasure Map for your Monitoring Data” by Yuri Shkuro
Here’s how it looks src
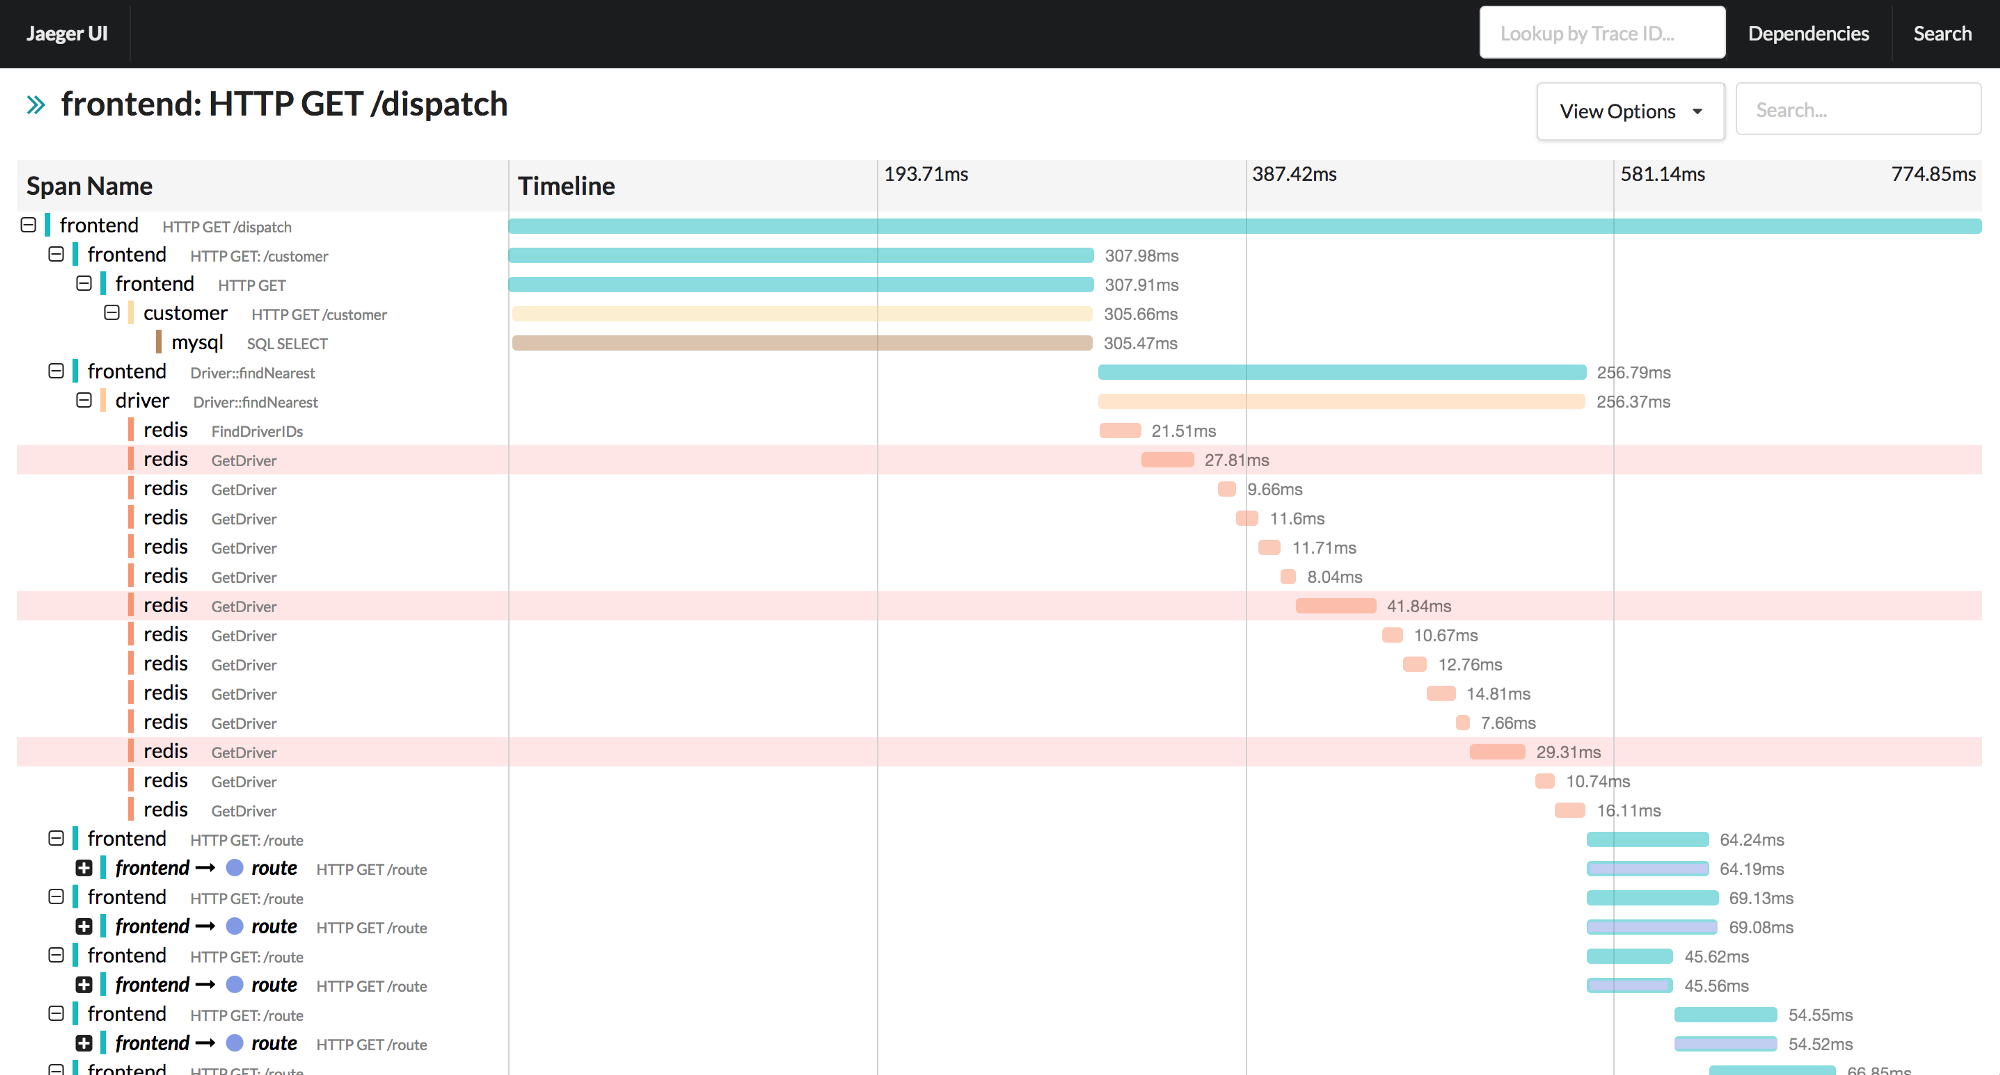
I loved Yuri’s talk since he also covers the issues of getting other teams to implement changes in code base to enable tracing.
Other notable mentions :)
-
Real-time packet analysis at scale by Douglas Creager. A technique used by Google to look for Bufferbloat. They capture network packet headers in real time and analyse behaviour at the edge of Google data centers and the Internet. By capturing just the headers, they can safely work with encrypted traffic.
-
Kubernetes-defined Monitoring by Gianluca Borello. Covered techniques and patterns to improve monitoring in the land of Kubernetes and containers. From naming convention to tools to make life easier. SysDig was the tool of choice - relies heavily on Linux Kernel Syscall instrumentation.
Math
The Tidyverse and the Future of the Monitoring Toolchain by John Rauser
The session floated the idea of borrowing a data scientist’s rich toolchain into the land of operational monitoring. The tools in question were ggplot, R and the Tidyverse.
I have had some exposure to the power of R and ggplot due to the work of Jonathan Palardy at Yahoo. One of the teams use it to assess the impact of a new deployment on an existing cluster.
I plan to learn R to explore the myriad of metrics we get and once we have the right metric, use it for dashboards and/or alerts.
Instrumenting SmartTVs and Smartphones in the Netflix app for modeling the Internet by Guy Cirino
To plan global rollouts of the Netflix platform, they put instrumentation in the app running on SmartTVs and Phones around the world. This enabled them to measure internet “health” as seen by a “real” client.
Data > Opinion
By having real data, they were able to make more informed decisions vs relying on opinions of various teams.
The session covered some cool statistical tricks (Inverse of Empirical Cumulative Distribution Functions!) used to store and encode metrics before transmitting them back to Netflix. This allowed calculation of p90 latency timings for DNS (for example) of various ISPs outside US without storing and transmitting the full dataset. Guy promised to put a working example on his blog to make the math easy to follow ;)
Automating Dashboard Displays with ASAP by Kexin Rong
Another great talk focusing on statistics and time series visualization backed with solid math. It showcases research on smoothing graphs to make them less noisy while retaining large-scale deviations. It’s available as a Javascript library!
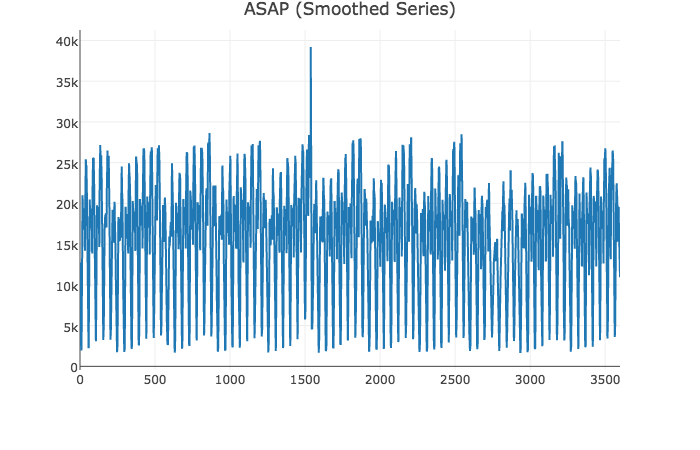
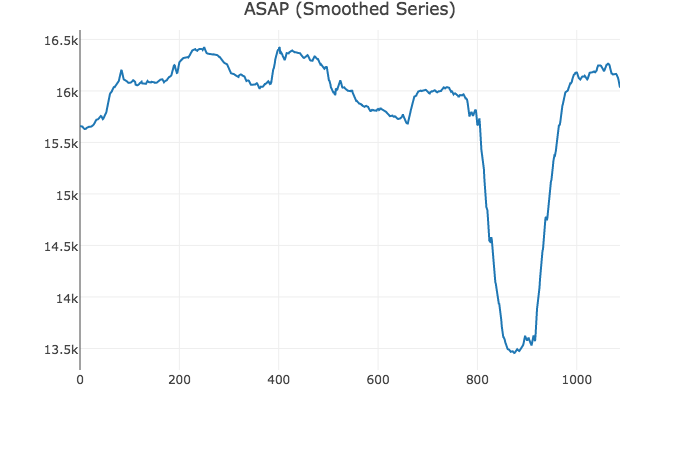
The smoothed data lets you pin-point the dip easily.
Here’s a live demo. Great concept! Looking forward to having this integrated with major graphing players.
Conclusion
Monitorama was great - single track format is perfect and all around great quality of speakers and content. It’s becoming common practice to have a slack channel at such events and its such a great resource. The team behind Monitorama were spectacular. Day 2 witnessed a power outage which took out core downtown. Starting Monday evening, the team was able to find a new venue and move 600 people + AV equipment + coffee to the new location in less than 12 hours. #opslife indeed!
The conference provided very comprehensive coverage on monitoring - hard math, culture, on-call, tools and methodology.